

A customer needs waterproof hiking shoes in size 42 by Friday. The agent finds the right model, but the sale price belongs to size 39 and the only pair in size 42 ships on Monday. The recommendation looks good until the shopper tries to buy it.
For a retailer, that failed recommendation can be more revealing than a traffic report. The store has a product page and a price. What the shopper needed was a buyable offer: a specific variant, a delivery promise for their location and a return policy that applies to that pair.
There is money in solving this problem, but it helps to know where to look. The first question is how many qualified shoppers actually reach a valid offer. The second is how many of those purchases the retailer would have won anyway.
- $3–5TGlobal B2C goods revenue agents could help orchestrate in 2030Scenario under adoption and merchant readiness assumptions. US range: $900B–$1T.McKinsey · 17 Oct 2025
- +693.4%Growth in visits from generative AI tools to US retail sitesNovember–December 2025 versus 2024. Referrals grew from a small base.Adobe Analytics · 7 Jan 2026
- 20%Share of global Cyber Week orders influenced by AI and agents25 Nov–1 Dec 2025. Salesforce counts recommendations and conversational customer service.Salesforce · 5 Dec 2025
How much demand is really new?
Adobe Analytics found that referrals from generative AI tools to US retail sites rose 693.4% year over year in November–December 2025, from a small base. The observation is a comparison of visits in Adobe's dataset. It provides no absolute AI referral share or estimate of incremental orders. McKinsey estimates a $3–5 trillion global and $900 billion–$1 trillion US B2C goods opportunity by 2030 under assumptions about adoption and merchant readiness. The scenario includes commerce mediated by agents, a broader category than purchases placed without human approval. Services and B2B are outside its scope.
The two sources inform different investment decisions. Referral growth justifies measuring whether agents already send valuable traffic to a category. The market scenario justifies avoiding systems that make future integration expensive. Neither supplies a retailer's expected conversion rate. Google describes an optional UCP Catalog capability for retrieving current variant, inventory and price data. It offers a route to better inputs. Merchants still need to establish data accuracy and supported capabilities for their own channel.
A product match is the beginning of a quote
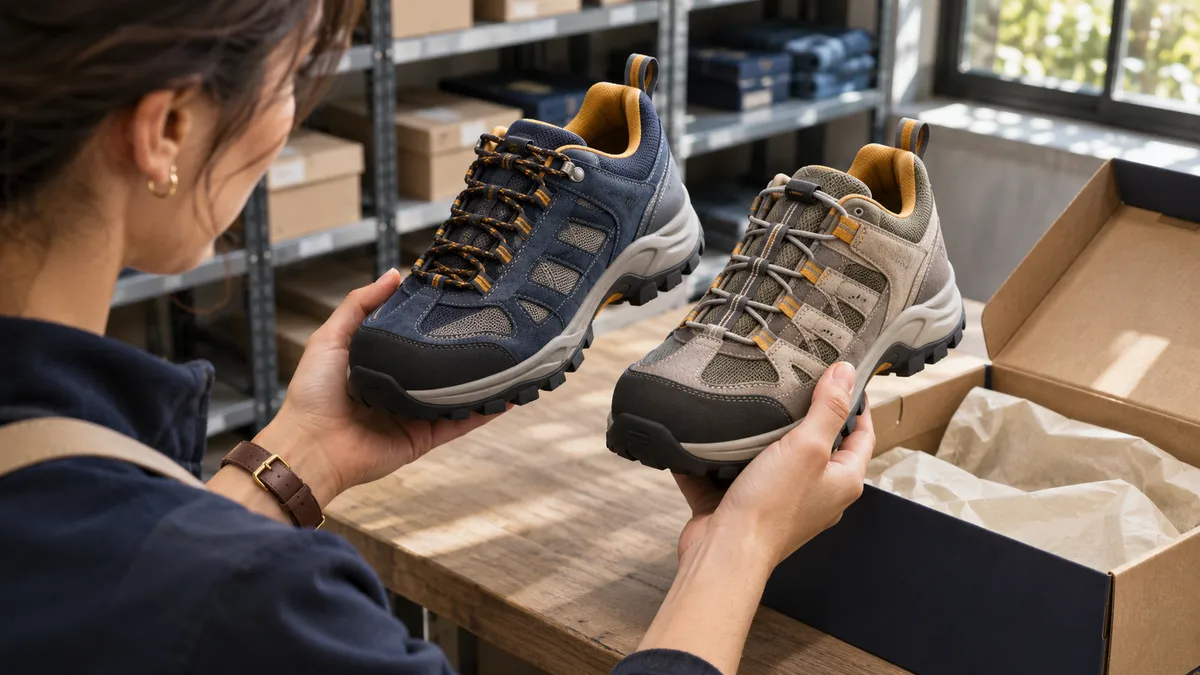
A shopper wants waterproof shoes, size 42, delivered by Friday, with free returns. A ranking system may find the correct product family and still recommend an ineligible variant. A verifiable offer binds the specific variant, total price, location-specific availability, delivery promise and return terms to a quote that the agent can check before action.
| Failure mode | Evidence at decision time | Merchant response |
|---|---|---|
| Offer refers to the product family | Variant ID, size system and eligibility | Match the exact sellable item |
| Stock or delivery changes | Current fulfillment quote and expiry | Revalidate before the shopper commits |
| Promotion excludes the selected variant | Final price, currency and conditions | Show the new total and obtain approval for changes |
| Return rule is absent | Category and variant policy | Ask the shopper or hand off rather than assume eligibility |
The business case also depends on channel substitution. Illustrative economics per 10,000 qualified AI referrals: at 3% conversion there are 300 attributed orders. With $18 contribution per order after fulfillment and expected returns, 40% incrementality implies 120 additional orders and $2,160 of additional contribution. Subtracting $1,200 in incremental integration, monitoring and support cost leaves $960. At 20% incrementality, the same attributed volume produces a $120 loss. The break-even incrementality is about 22.2% ($1,200 ÷ $5,400). These assumptions are examples. A holdout and actual cost data should replace them.
When to invest in agent checkout
Through 2030, standardized categories such as electronics accessories and replenishment goods are plausible early candidates for delegated purchasing. Shoppers can state what they need, and stores can verify more of it from structured data. Fit-heavy categories still ask the shopper to resolve trade-offs that a catalog cannot settle.
The useful signal is a rise in correctly fulfilled delegated orders with positive contribution after returns. If referrals rise while that measure stays flat, put the next dollar into offer accuracy and fulfillment. If both measures improve in the holdout, consider a limited checkout integration.
Start with one shelf, then earn the right to expand
- Weeks 1–3. Establish a baseline. Pick one category. Sample successful and failed requests across price bands, variants and delivery regions. Record correct matches, quote mismatches and policy omissions. Separate visits referred by an AI tool from AI-assisted orders and verified delegated orders.
- Weeks 4–7. Compare candidate approaches. Give the same requests to the current workflow and an agent connected to read-only catalog and fulfillment data. Ask reviewers to score against the buyer's original constraints. Include stale offers, unavailable sizes and substitution requests. Count appropriate abstentions separately from false matches.
- Weeks 8–12. Measure incrementality. Use a randomized holdout where feasible. Measure contribution per eligible session, including returns, support and incentives. Require a verified variant and fresh total before accepting a delegated purchase. Expand only when the improvement survives after-cost analysis and error rates meet the category's agreed tolerances.
Evidence limits. Adobe provides observed referral growth, McKinsey a modeled scenario and Google a platform specification. This synthesis does not estimate adoption for a particular country or merchant. Category economics and test results should determine local rollout.
Sources and related research
- Adobe Analytics, 2025 holiday shopping results, January 2026 — measurement period and referral definition.
- McKinsey, The agentic commerce opportunity, October 2025 — 2030 goods scenario and assumptions.
- Google, UCP catalog and cart capabilities, March 2026 — announced integrations.
- GAEO.ai, the Visa shopping-agent benchmark and e-commerce order operations.